Data Shows Declining Home Sales in Catonsville
Examining the numbers for Catonsville shows a noticeable decrease in the annual number of houses sold over the past few years
MARKET UPDATES
Matt Totaro
4/16/20252 min read
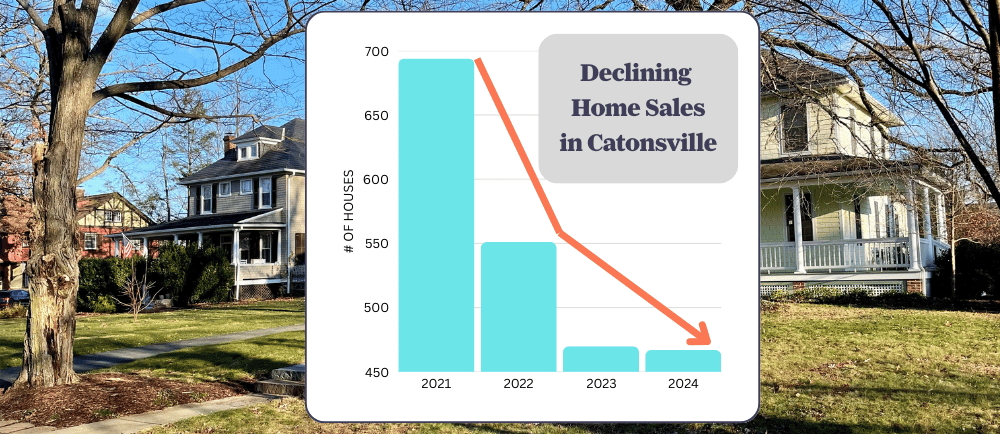
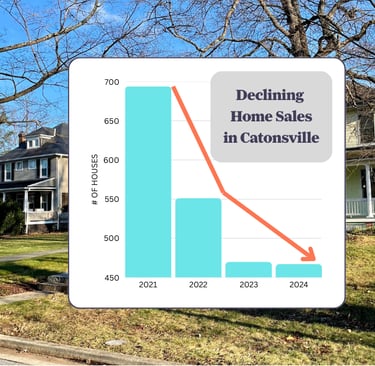
There's always a story in the data. Examining the numbers for Catonsville shows a noticeable decrease in the annual number of houses sold over the past few years:
Annual Home Sales in Catonsville:
2021: 694 houses
2022: 551 houses
2023: 470 houses
2024: 467 houses
Catonsville Home Sales by End of March:
2021: 117 houses
2022: 88 houses
2023: 90 houses
2024: 86 houses
2025: 71 houses
This pattern indicates two clear trends:
Overall Declining Sales Volumes
Over the span from 2021 to 2024, the total annual home sales in Catonsville have steadily decreased. Several factors could be behind this declining trend:
Market Cooling:
After a surge in activity post-pandemic, the market might be experiencing a cooling-off period. The high sales volume seen in 2021 could have reflected a rebound from earlier restrictions or low inventory conditions which have since normalized.Economic Influences:
Rising interest rates, inflation, or other economic uncertainties often lead to reduced buying power. Homebuyers might be more cautious, seeking stability before committing to significant investments. This economic tightening can reduce the number of transactions.Local Demographics and Inventory:
Shifts in the local population or changes in housing inventory (such as fewer homes being available for sale) can directly influence sales figures. If fewer homes come onto the market, there are simply fewer transactions—even if demand is relatively steady.
Early Year Sales as Leading Indicators
The monthly snapshot data from the end of March for each year also tells an important story:
While early-year numbers in 2022, 2023, and 2024 were relatively similar (ranging between 86 and 90 homes), 2025 shows only 71 homes sold by the end of March.
This early shortfall suggests that if the pace observed in January through March continues, the total annual sales for 2025 are likely to be even lower than those of 2024.
What This Trend Means
The declining numbers over several years, paired with the early slowdown in 2025, indicate a possible shift in the local housing market dynamics. This might include:
Reduced Demand or Buyer Caution:
Economic uncertainty or less competitive financing conditions (like higher mortgage rates) could be deterring buyers.Supply Constraints:
There may be fewer homes available to purchase, either due to less construction, more robust retention of properties by homeowners, or a strategic choice by sellers in uncertain times.Market Adjustments:
The market could be undergoing a natural correction after an earlier period of unsustainably high sales. This correction process may lead to lower overall volumes but potentially more stabilized prices and more sustainable long-term growth.
Conclusion
The data from Catonsville illustrates a clear downward trend in home sales from 2021 to 2024 and an early indication for 2025 that the pace is even lower. Factors such as economic conditions, market corrections after a post-pandemic surge, and local supply and demand dynamics could be contributing to these trends. Stakeholders—ranging from buyers and sellers to real estate professionals—should be aware that this pattern suggests a cooling market, where caution and strategic planning become even more critical.
Contact Matt Totaro at 443-814-9008 or matt@catonsville.living
Brought to you by:
CONTACT
© 2025 The Catonsville Report All rights reserved.
Matt Totaro
licensed Maryland agent
1765 Greensboro Station Pl Suite #900 McLean, VA 22102
License: 5019524